Starting from our ZAMS model, we will now make the star rotate.
We will continue to work on
While this model is running (this should take about 5 minutes), let's think about the physical meaning of the changes we have just made.
Remember that the rotatioinal velocity $\Omega = v/r$.
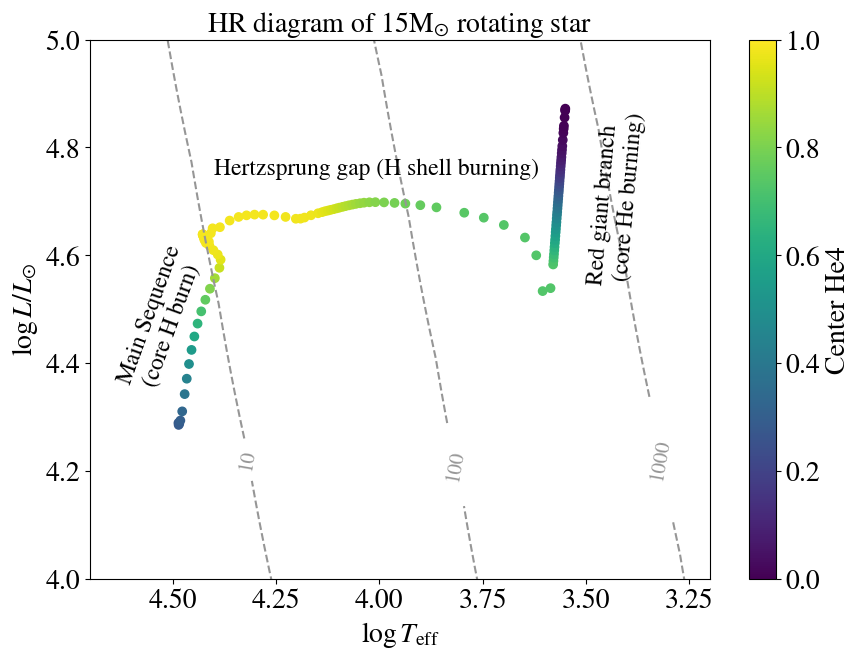
The Hertzsprung-Russell (HR) diagram of the rotating ZAMS model will look something like this:
Rotating Zero Age Main Sequence
inlist_rotating_star.
The question that we are hoping to address is: what does the rotation do to the star?
Task R.1
inlist_rotating_star:
&star_job

(...)

! Change the initial rotation of the star
change_rotation_flag = .true.  !enabling rotation
new_rotation_flag = .true.

! specify the initial rotation as a fraction of the critical rotation
set_initial_omega_div_omega_crit = .true.
new_omega_div_omega_crit = 0.2
inlist_rotating_star:
xa_central_lower_limit_species(1) = 'he4'
xa_central_lower_limit(1) = 1d-6
termination code: xa_central_lower_limit. Task R.2
What happens to a rotating star as it evolves?

The dashed grey lines indicate lines of constant radius (we can draw lines of constant radii for every $T_{\mathrm{eff}}$ and $L$ because of the
Stefan Boltzmann law).
We colored the points the HR evolution by the central helium fraction, to indicate the evolutionary state of the star.
That is, as the star burns H in the core the central helium fraction increases to 1.
Next the star burns H in a shell and the star moves to the right in the HR diagram, across the 'Hertzsprung gap'.
When the star starts burning He in the core, the central helium fraction decreases, and the star moves up the red giant branch.
It is now interesting to look at the output of your model. Open a new Jupyter notebook and load the history data of your model. If you need a refresher on how to look at the output of your MESA model, have a look at the MESA output page on Part 1 of this hackathon.
Task R.3
- Plot the surface rotation velocity as a function of the age of the star.
Color the points by the center_he4 fraction to keep track of the evolutionary state of the star (similar to the HR diagram above).
Do the same for the $\Omega/\Omega_{crit}$.
- At what moments does the star spin up or spin down? (hint: compare the evolutionary stage in your figure to the evolution in the HR diagram)
- What is the surface velocity at I) the start of core H burning (Zero Age Main Sequence) II) the end of core H burning, and III) the end of core He burning?
Since we are interested in the rotation of the core, the internal rotation profile of the star is of more interest than just the surface rotation.
To do this, you want to read in the profile data of your star. Have a look at the profiles.index file to see which profiles are available.
Again, see the MESA output page for more information on how to read in the profile data.
Task R.4
- Can you imagine why/when the core will spin up or spin down?
Plot omega as a function of the mass coordinate of the star at the following evolutionary stages:- I) Zero Age Main Sequence (ZAMS)
- II) the end of core H burning, or Terminal Age Main Sequence (TAMS)
- III) core He-exhaustion
profiles.indexfile, which lists all the profiles and their corresponding module_number. Check the central H fration for each of these module_numbers using the history.data to define TAMS.
- © Untitled
- Design: HTML5 UP